Is Glendora the best Mississippi city for your business?

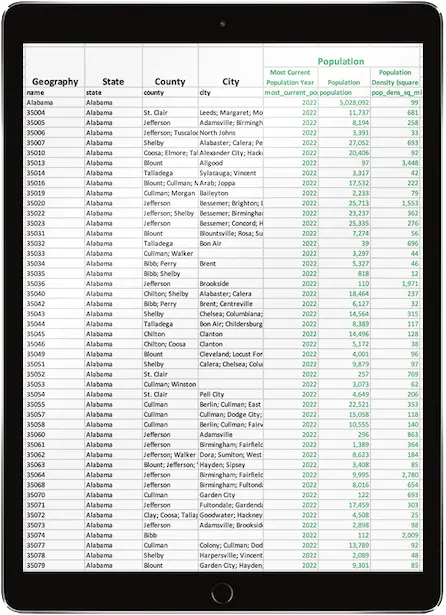
Now you can skip hours of internet research and jump straight to getting answers with our meaningful at-a-glance Demographics by City Report. With the most current & most popular demographic data, it's the perfect starting point for your research about Glendora and the rest of Mississippi.

  • Don't waste 8 to 10 high-value hours searching the US Census Bureau site
  • Get up-to-date demographic data, ready to present or share
  • Spend more time using demographic data... and no time compiling it
  • Learn More

We know Glendora Demographics, just keep scrolling...

Glendora Population

Sources: United States Census Bureau. 2021 American Community Survey 5-Year Estimates. U.S. Census Bureau, American Community Survey Office. Web. 8 December 2022.

United States Census Bureau. Annual Estimates of the Resident Population: April 1, 2020 to July 1, 2021. U.S. Census Bureau, Population Division. Web. May 2022. http://www.census.gov/.

United States Census Bureau. Annual Estimates of the Resident Population: April 1, 2010 to July 1, 2019. U.S. Census Bureau, Population Division. Web. May 2021. http://www.census.gov/.

United States Census Bureau. "P2 Hispanic or Latino, and Not Hispanic or Latino by Race." 2020 Census State Redistricting Data (Public Law 94-171) Summary File. U.S. Census Bureau, 2020 Census. Web. 12 August 2021. https://www.census.gov/.

Check out our FAQs for more details.

Glendora Demographics Summary

population icon Population

With 160 people, Glendora is the 374th most populated city in the state of Mississippi out of 423 cities. But watch out, Glendora, because Marietta with 156 people and Kossuth with 147 people are right behind you.

race icon Race & Ethnicity

The largest Glendora racial/ethnic groups is Black (100.0%)

income icon Median Income

In 2021, the median household income of Glendora households was $10,875. Glendora households made slightly more than University households (-$666,666,666), Mississippi State households (-$666,666,666), Cleary households (-$666,666,666), Victoria households (-$666,666,666), Arnold Line households (-$666,666,666), Wade households (-$666,666,666), Brooksville households (-$666,666,666), Conehatta households (-$666,666,666), North Tunica households (-$666,666,666), Helena households (-$666,666,666), Tucker households (-$666,666,666), Scooba households (-$666,666,666), Redwater households (-$666,666,666), State Line households (-$666,666,666), Toomsuba households (-$666,666,666), Clara households (-$666,666,666), Bogue Chitto CDP households (-$666,666,666), Bentonia households (-$666,666,666), Baxterville households (-$666,666,666), Wheeler households (-$666,666,666), Agricola households (-$666,666,666), Artesia households (-$666,666,666), Bogue Chitto CDP households (-$666,666,666), Osyka households (-$666,666,666), Shuqualak households (-$666,666,666), Eagle Bend households (-$666,666,666), Toccopola households (-$666,666,666), Louin households (-$666,666,666), Eden households (-$666,666,666), Cruger households (-$666,666,666), Silver City households (-$666,666,666), Moselle households (-$666,666,666), Glen Allan households (-$666,666,666), Elizabeth households (-$666,666,666), Skene households (-$666,666,666), Paris households (-$666,666,666), Fernwood households (-$666,666,666), Independence households (-$666,666,666), Bovina households (-$666,666,666), Longview households (-$666,666,666), Kokomo households (-$666,666,666), Buckatunna households (-$666,666,666), Woodland households (-$666,666,666), Falcon households (-$666,666,666), Montrose households (-$666,666,666), New Site households (-$666,666,666), Pattison households (-$666,666,666), Winterville households (-$666,666,666), Stewart households (-$666,666,666), Red Banks households (-$666,666,666), Eastabuchie households (-$666,666,666), Slate Springs households (-$666,666,666), Bolivar households (-$666,666,666), Satartia households (-$666,666,666), Austin households (-$666,666,666), Ovett households (-$666,666,666), Scott households (-$666,666,666), Panther Burn households (-$666,666,666), Tillatoba households (-$666,666,666), Symonds households (-$666,666,666), Stoneville households (-$666,666,666), Dundee households (-$666,666,666), Tula households (-$666,666,666), Strayhorn households (-$666,666,666), Benndale households (-$666,666,666), Redwood households (-$666,666,666), Waterford households (-$666,666,666), Leaf households (-$666,666,666), Van Vleet households (-$666,666,666), and Chalybeate households (-$666,666,666) . However, 77.8% of Glendora families live in poverty.

age icon Median Age

The median age for Glendora residents is 29.4 years young.

FACT

86% of people CANNOT find the data they're looking for on the US Census Bureau website. Source: Nielsen Norman Group

We are CUBIT
We have 25+ years of experience and proprietary data-wrangling technology to research, download, format, analyze, visualize & cite the data you need.

Customer Quotes:

"Your starter report certainly saved me a considerable amount of time. I am just too busy to garner this needed data any other way. It truly would have taken hours of an employee's time or my own to get this much information. I was fortunate to find a company that had all the demographics that I needed and at a very reasonable price."

"My supervisor had assigned me the task of getting population data for the county for our required county education strategic plan. I had some information from Kids Count but need race, gender, age, etc. and the government census site was shutdown. I was so surprised to get a report within seconds and it had lots of charts and graphs that my supervisor liked."

YES! I want a Demographics By City Report for Mississippi!

Prices start at just $49. Fill out our order form and receive your data as an instant download.

Every report comes with a 100% Money-Back Guarantee

If you are unhappy for any reason, we'll happily refund your money.

Buy Now

Connect

Cubit logo

© Copyright 2023 Cubit Planning, Inc.