Richest Counties in Mississippi (2026)
by Kristen Carney
Updated: February 9, 2026
Richest County in Mississippi
The richest county in Mississippi is Madison County with an average household income of $121,926 as of 2024 and 111,647 people as of 2024 according to the most current Census data available (citation).
| Rank | County | Population | Average Income | Median Income |
|---|---|---|---|---|
| 1 | Madison County | 111,647 | $121,926 | $83,441 |
| 2 | Lafayette County | 58,327 | $103,704 | $67,185 |
| 3 | DeSoto County | 191,301 | $101,760 | $85,297 |
| 4 | Rankin County | 158,854 | $100,005 | $79,357 |
| 5 | Lamar County | 65,713 | $96,987 | $70,909 |
| 6 | Hancock County | 46,167 | $94,339 | $67,708 |
| 7 | Itawamba County | 24,036 | $88,884 | $55,546 |
| 8 | Jackson County | 145,249 | $88,071 | $66,201 |
| 9 | Lee County | 83,034 | $87,122 | $67,863 |
| 10 | Warren County | 43,020 | $82,803 | $59,401 |
| 11 | Tate County | 28,321 | $81,048 | $69,704 |
| 12 | Harrison County | 210,891 | $80,923 | $59,479 |
| 13 | Attala County | 17,526 | $78,646 | $51,639 |
| 14 | Forrest County | 78,272 | $78,383 | $53,640 |
| 15 | Copiah County | 27,855 | $78,358 | $49,089 |
| 16 | George County | 25,170 | $77,416 | $59,758 |
| 17 | Jones County | 66,472 | $76,759 | $52,216 |
| 18 | Union County | 28,122 | $75,967 | $55,505 |
| 19 | Pearl River County | 57,458 | $75,551 | $58,135 |
| 20 | Simpson County | 25,691 | $74,917 | $56,381 |
Median Income versus Average Income: Which Should You Use?
We usually suggest using median income data – either instead of or in addition to – average income data as a true indicator of wealth. If you haven’t thought about median versus average since your last standardized test, you aren’t alone. Here’s what they are:
- average is the sum of a set of numbers divided by the count of numbers in the set
- median is the middle number in the set of numbers
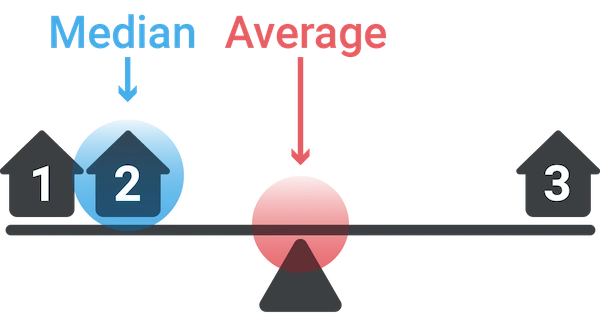
Now let’s say you had the following simplified set of income data.
Household 1: $30,000
Household 2: $50,000
Household 3: $1,000,000
The average income for this set is $360,000. The outlier data point ($1,000,000) skews the average WAY up. Conversely, the average income would be skewed WAY down if someone had an income of $500. The median income for the same data set is $50,000. Outlier data doesn’t skew the median.
Most Business Owners Should Use Median Income
So most business owners should use the median income as a true indicator of wealth, because it provides a more accurate representation of a typical income, especially in areas with significant income disparity.
When Should You Use Average Income
If your target market is high-income households, the average income may be more relevant. This is because the average income can highlight the presence of a higher concentration of wealthy individuals, which is beneficial for luxury goods and services marketing. We’re using average income on this page because using the Census’s highest reported median value of $250,001 could result in multiple ties for the richest geography.
Why do so many cities have a median value of $250,001?
The Census' American Community Survey uses $250,000+ as a jam value for median income estimates to protect privacy, ensure data consistency, and simplify reporting. A "jam value" in survey data refers to a placeholder or default value used when actual data points are unavailable, incomplete, or exceed certain thresholds. We represent this jam value as $250,001 to make it easy for you to sort.
You might also be interested in:
Email Me When New Data Are Released
Join thousands of subscribers and receive just 1 (ONE!) email a year in December when the US Census Bureau releases new income data for Mississippi richest counties.
SOURCES
United States Census Bureau. Annual Estimates of the Resident Population: April 1, 2020 to July 1, 2024. U.S. Census Bureau, Population Division. Web. May 2025. http://www.census.gov/.
United States Census Bureau. B01001 SEX BY AGE, 2024 American Community Survey 5-Year Estimates. U.S. Census Bureau, American Community Survey Office. Web. 29 January 2026. http://www.census.gov/.
United States Census Bureau. B19013 Median Household Income, 2024 American Community Survey 5-Year Estimates. U.S. Census Bureau, American Community Survey Office. Web. 29 January 2026. http://www.census.gov/.
United States Census Bureau. “DP03 SELECTED ECONOMIC CHARACTERISTICS.” 2024 American Community Survey 5-Year Estimates. U.S. Census Bureau, American Community Survey Office. Web. 29 January 2026. http://www.census.gov/.
Products & Services
Plumbing
Connect
- 1-800-939-2130
- Contact Us
© Copyright 2026 Cubit Planning, Inc.